

The arithmetic already works. A costed, phased Global Universal Basic Income could bring meaningful income support to every poor adult on Earth within thirteen years, for about $7 trillion a year. The numbers suggest the world can build this, and at the very least, should be testing it.
By Don Clancy
Nearly 700 million people live in extreme poverty by the World Bank’s outdated yardstick, but horrifyingly the true number is significantly worse. The World Bank’s June 2025 update to the global poverty lines raised the International Poverty Line from $2.15 to $3.00 a day, driven by updated purchasing-power data rather than any sudden collapse in living standards. Below this revised threshold, roughly 817 million people were living in extreme poverty in 2024, though the World Bank’s March 2026 update to the same series has since revised that figure upward to 847 million, an increase driven mainly by newly incorporated Pakistan survey data. The world did not get poorer overnight; the measuring stick simply got more accurate.
That $3-a-day figure is also the anchor for a proposal that deserves to move from academic paper and debate to an international policy priority: a Global Universal Basic Income (GUBI). National basic-income pilots have been run in diverse countries from Kenya to Finland, but a global, centrally administered version, funded by richer economies and paid to the world’s poorest adults, has rarely been costed out in detail. I did the costing. It works, and it deserves to be tested, not dismissed as a thought experiment.
The model below shows that poverty-line-anchored payment, a progressive funding formula, and a phased rollout balance [GM1] on paper at roughly $7 trillion a year; a real, checkable number the world can afford. What’s missing is not the money. It’s the decision to spend it.
No Poor Country Can Fund This Alone
Before getting to the mechanism, it’s worth being blunt about why this has to be a global initiative. A national government cannot lift its own citizens out of poverty by granting a domestic basic income if it does not have the money to do it, and the poorest countries simply do not.
Take Burundi, where World Bank data puts average income under $16 a month. A poverty-line payment of $91.32 a month is nearly six times that entire average income. No Burundian government could tax its way to that kind of transfer; there is simply not enough income in the country to redistribute.
This is not unique to Burundi. Across Sub-Saharan Africa, government tax revenue averages under 20% of Gross Domestic Product (GDP), which is roughly half the tax take collected in wealthy economies. Poor countries are poor precisely because they lack the tax base, the administrative capacity and the borrowing power to fund transformative social programmes on their own.
This is why even small-scale pilots have needed outside money. GiveDirectly’s basic income study in Kenya, the largest and longest-running Universal Basic Income (UBI) experiment in the world, is funded by international donors, not the Kenyan treasury, because Kenya’s own budget could never have borne it even as a pilot. If a basic income is going to reach the world’s poorest people on a meaningful scale, the money must come from somewhere richer. That is the entire logic behind GUBI’s progressive, richer-country-funded design, and it’s why “let poor countries run their own UBI” is not and can never be a serious alternative.
Why Waiting Is the Real Risk
Beyond poverty and human dignity, two other forces make delivering Global Universal Basic Income critically urgent rather than academic, both are already visible and have massive potential to disrupt the Global North societies and economies.
The first is migration, though the evidence here is genuinely mixed and shouldn’t be oversold. World Bank researchfound that an additional 1% of GDP in rural development aid is associated with emigration rates falling from about 4.3% to 3.4%. But economists Michael Clemens and Hannah Postel, along with Hein de Haas, have documented a “migration hump”: emigration from developing countries tends to rise before it falls, typically peaking between $6,000 and $10,000 per capita. A 2024 panel-data reanalysis found that over longer time horizons rising incomes reduce emigration, contradicting the migration-hump pattern.
The honest summary is that nobody can promise GUBI will fix migration in either direction, but that uncertainty is an argument for building the safety net anyway, not a reason to wait for a consensus that may never arrive.
There is a harder-edged version of this argument too. Across Europe and the United States, migration has become one of the central drivers of the rise of populist Right parties and movements, and governments are spending accordingly. The European Union’s 2028–2034 budget nearly triples migration and border spending to €81 billion, with the border agency Frontex alone set to receive €11.9 billion, more than doubling its current budget. The United States has spent an estimated $409 billion on immigration enforcement agencies since 2003, with ICE’s own budget nearly tripling to $9.6 billion by fiscal year 2024. Germany offered a version of this logic directly in July 2026, when Chancellor Friedrich Merz’s coalition unveiled a “Programme for Revival and Employment” package, including roughly €10 billion a year in tax relief for lower- and middle-income earners, a package the Chancellor explicitly framed as a response to the country’s surging far-right AfD party. If wealthy democracies are already prepared to spend tens of billions responding to migration pressure at home, a GUBI-scale investment in the places people are leaving in the first place is not a radical reallocation of resources. It is a bet on prevention over reaction, one that is arguably cheaper than the highly expensive and uncertain alternatives currently being rolled out by the West.
The second pressure is harder to dismiss: Artificial Intelligence (AI)-driven labour disruption. The International Monetary Fund’s (IMF) January 2024 staff note estimated that roughly 40% of global employment is exposed to AI, and warned that, left unmanaged, the transition is likely to worsen income inequality. A GUBI is one of the few proposed mechanisms on the table that could function as a floor under a global labour market that may be about to transform faster than any social safety net was designed for. Waiting for perfect certainty on this point means designing the safety net after the fall, not before it.
The Mechanism That Makes It Work
GUBI rests on three moving parts: who pays, who receives, and how the money physically reaches people.
- Which Countries Pay?
Richer countries pay, on a sliding scale pegged to their own Gross National Income (GNI) per capita, similar in structure to a domestic income-tax bracket system. Below a floor of $4,635 GNI per capita, the ceiling of the World Bank’s “lower-middle-income” classification, countries contribute nothing. That floor is a modelling choice, not settled policy, but it reflects the same principle established above: you cannot fund poverty relief out of an economy that has no surplus to tax.
GNI per Capita: Richest and Poorest Countries
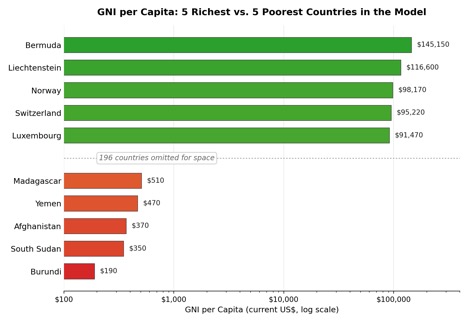
Countries shown are the five highest and five lowest by GNI per capita among the 206 modelled economies; values are Year-1 GNI per capita in current US$, before the model’s 1% annual growth assumption is applied. The 196 countries in between are omitted for space, not from the model itself.
- Who Benefits?
Every adult aged 15 and over receives the same flat payment: $91.32 a month at launch, rising 1% a year, anchored directly to the $3-a-day poverty line. That amount is transformative in Burundi and negligible in Switzerland, a deliberate simplification, chosen for administrative simplicity rather than perfect equity.
- Money Transfer Mechanisms
Getting the money into people’s hands means layering three delivery systems:
- Existing mobile networks. Ninety-six percent of the world’s population already lives somewhere with mobile internet coverage. For the roughly 79% of adults with a bank or mobile-money account, payments move as ordinary digital transfers at an assumed 2.3% cost, half the going digital-remittance rate. For the unbanked minority within that coverage, the model adds a 30% delivery premium, based on real humanitarian cash-transfer experience.
- Closing the coverage gap. Roughly 300 million people have no mobile network access at all. GSM Association (GSMA) estimates closing that gap would cost about $418 billion, a one-time infrastructure cost the model funds upfront.
- Purpose-built devices for the truly unreachable. For the hardest-to-reach populations, the model assumes $50 satellite-linked e-wallet devices paired with shared $100 point-of-sale terminals, priced well below current commercial satellite hardware sold in Kenya and across Africa more broadly today. No such purpose-built device exists yet, but nothing about it is implausible engineering.
One Assumption Sceptics Will Seize On
The model’s most contestable assumption is rich-country uptake. To be clear, this has nothing to do with whether a rich country joins the scheme; that question is already settled by the funding formula above. It concerns a narrower, more uncertain assumption: whether individual citizens inside a wealthy country will bother to claim their own monthly payment once it exists. Below the World Bank’s high-income threshold, roughly $14,000 GNI per capita, the model assumes every eligible adult claims it; above that line, claiming is assumed to taper off on a logistic curve to a 15% floor. This is, frankly, invented arithmetic dressed up as a curve. No scheme of this design or scale has ever been tried, so uptake data from Alaska, Finland or anywhere else can’t settle the question.
Critics are right that the specific shape of that curve is a guess. Sensitivity testing shows the cost impact is real but containable: if every eligible adult globally claimed their payment, with no drop-off at all, year-thirteen cost would rise by roughly $1 trillion, to about $8.1 trillion. Under the model’s funding calibration, contributions would simply scale up to match, roughly 15% higher across donor countries, and the reserve would stay positive throughout. Either way, whether rich-country citizens bother to collect a small monthly payment doesn’t change the case for GUBI; it only changes the size of the bill the funding formula must cover.
A 13-Year Rollout Built to Absorb Shock
GUBI will not switch on overnight and its effects won’t be seen immediately. It phases in over 13 years, and the sequencing itself is part of what makes it credible rather than reckless. - Years 1–3 (setup): Contributions ramp up gradually while the money funds one-time infrastructure: the mobile coverage gap and the satellite devices, plus a small running-cost overhead that starts from day one. No benefit payments are made in this period. Year one spending is $0.154 trillion in total, almost all of it on infrastructure.
- Years 4–13 (rollout): Payments begin, poorest countries first, ranked by GNI per capita. A reserve built up during setup, reaching about $2.5 trillion by year three, enables the model to accelerate past a strict linear schedule, reaching about 32% coverage in the very first rollout year instead of the 10% a linear pace would allow.
- Throughout: Acceleration is deliberately capped at half the reserve’s excess above a $1 trillion stability cushion each year, so the reserve never runs dry. It troughs at roughly $1.3 trillion in year seven, stabilises in a $1.3–$1.4 trillion band through the middle rollout years, and closes the programme at roughly $1.3 trillion, with funding and spending balanced from year thirteen onwards.
What It Costs and Why It Balances
By year thirteen, with full coverage and the payment risen to roughly $102.90 a month, annual cost reaches about $7.05 trillion, a number that would need measuring against real GDP comparators rather than treated as abstractly enormous.
Remittance flows to low- and middle-income countries alone reached an estimated $685 billion in 2024. Official development assistance and foreign direct investment each run in the hundreds of billions annually on the same accounting basis. Global GDP topped $100 trillion in 2024, putting GUBI’s full cost at about 7% of world output, a meaningful ask, but not an impossible one for a coordinated group of wealthy economies.
GUBI 13-Year Cash Flow by Type
| Year | Number of Donating Countries | Number of Countries Receiving | Income | Infrastructure | Running Costs | Benefits | Fees | Net Cash Flow | Reserve |
| 1 (Setup) | 130 | 0 | 0.48 | 0.14 | 0.01 | 0.00 | 0.00 | 0.33 | 0.33 |
| 2 (Setup) | 130 | 0 | 0.97 | 0.14 | 0.01 | 0.00 | 0.00 | 0.82 | 1.15 |
| 3 (Setup) | 130 | 0 | 1.47 | 0.14 | 0.01 | 0.00 | 0.00 | 1.32 | 2.47 |
| 4 (Rollout) | 130 | 53 | 1.98 | 0.00 | 0.12 | 1.88 | 0.05 | -0.06 | 2.40 |
| 5 (Rollout) | 130 | 69 | 2.50 | 0.00 | 0.18 | 2.74 | 0.07 | -0.48 | 1.92 |
| 6 (Rollout) | 130 | 79 | 3.04 | 0.00 | 0.21 | 3.19 | 0.08 | -0.45 | 1.47 |
| 7 (Rollout) | 130 | 90 | 3.58 | 0.00 | 0.23 | 3.47 | 0.09 | -0.21 | 1.26 |
| 8 (Rollout) | 130 | 109 | 4.13 | 0.00 | 0.25 | 3.76 | 0.09 | 0.02 | 1.29 |
| 9 (Rollout) | 130 | 124 | 4.69 | 0.00 | 0.28 | 4.18 | 0.10 | 0.13 | 1.41 |
| 10 (Rollout) | 130 | 128 | 5.27 | 0.00 | 0.32 | 4.80 | 0.12 | 0.03 | 1.44 |
| 11 (Rollout) | 130 | 128 | 5.85 | 0.00 | 0.36 | 5.42 | 0.14 | -0.06 | 1.38 |
| 12 (Rollout) | 130 | 130 | 6.45 | 0.00 | 0.40 | 6.01 | 0.15 | -0.11 | 1.27 |
| 13 (Rollout) | 130 | 206 | 7.05 | 0.00 | 0.43 | 6.46 | 0.16 | 0.00 | 1.27 |
| Total | N/A | 206 (full) | 47.46 | 0.43 | 2.82 | 41.89 | 1.05 | 1.27 | 1.27 (final) |
All dollar figures in $ trillions. “Number of Donating Countries” is the roughly 130 economies above the $4,635 GNI-per-capita contribution floor, a count held constant across the programme. Each donating country’s contribution phases in gradually rather than starting at full strength: every country pays just 1/13 of its maximum assessed contribution in year one, rising by a further 1/13 each year until it reaches the full amount in year thirteen, which is why Income keeps climbing even though the country count never changes. “Number of Countries Receiving” counts how many of the 206 modelled economies, ranked poorest-first by GNI per capita, are needed to reach that year’s actual covered population; it rises unevenly because countries vary enormously in population size. Infrastructure covers GSMA network rollout, devices and point-of-sale terminals, and Low Earth Orbit (LEO)-linked device development and distribution, all spent during the three-year setup phase. Running Costs applies a 6.5% institutional overhead rate, benchmarked to the World Food Programme’s Indirect Support Cost rate, to that year’s infrastructure and benefit spending. Benefits is now shown net of delivery costs; Fees, the distribution and remittance overhead this removes, is broken out as its own line rather than hidden inside Benefits. Figures are drawn from the author’s GUBI cash-flow model.
Illustrative Country Contributions and Receipts
| Country | Gross National Income, Total ($ Billions) | Population (Total) | GNI per Capita ($) | Total Contributions Over 13-Year Programme ($ Billions) | Total Receipts Over 13-Year Programme, Net of Fees ($ Billions) | Net Contribution Over Full Programme ($ Billions) | Net Contribution Per Capita, Year 13 ($) |
| United States | 28,536 | 341,784,857 | 83,490 | 18,189 | 53 | 18,136 | 7,753 |
| United Kingdom | 3,438 | 69,487,000 | 49,470 | 2,009 | 13 | 1,996 | 4,104 |
| Brazil | 2,124 | 213,421,037 | 9,950 | 351 | 1,038 | -687 | -748 |
| South Africa | 385 | 63,100,945 | 6,100 | 26 | 338 | -312 | -853 |
| Sudan | 37 | 51,662,000 | 720 | 0 | 363 | -363 | -735 |
All dollar figures in $ billions; GNI and GNI per capita are Year-1 values before growth. Total Contributions follows the same 1/13-per-year ramp as the aggregate model. Total Receipts is net of distribution and remittance fees and begins only once the poorest-first rollout schedule reaches that country’s population. A negative Net Contribution means the country receives more over the 13-year programme than it pays in, as intended for lower-income countries. Net Contribution Per Capita, Year 13 uses only that single year’s contribution and receipt, divided by total population, to show the steady-state annual burden or benefit per person once the programme is fully phased in.
The Blueprint Exists. Now We Need a Pilot
None of GUBI’s delivery mechanics is theoretical or half-baked. The funding formula, the delivery layers, the phased rollout and the reserve mechanism are all built from real institutions and real data: GSMA infrastructure costs, World Bank poverty lines and Global Findex banking data among them. What’s missing is not a mechanism. It’s a government or coalition willing to test one.
Sceptics are right that a “GUBI bank” has never existed, that rich-country taxpayers have never funded anything at this scale, and that the politics of persuading dozens of governments to cede money and control could unravel the entire plan. Those are real risks, and pretending otherwise would be dishonest. But risk is not the same as impossibility, and every year spent treating GUBI as a thought experiment is a year of unnecessary poverty that a costed, phased plan could have started reducing.
A global rollout is not the only place to start, and it may not be the most persuasive one. Sub-Saharan Africa already receives tens of billions of dollars a year in official development assistance, much of it passing through several layers of implementing agencies and contractors before it reaches an actual household, with a proportion lost or diluted at every step. A continental pilot, built on the same direct-to-wallet infrastructure costed by this model, would test the two questions that matter most before any attempt is made at a global rollout: whether a purpose-built payment institution can reach people more cheaply than the current aid architecture, and whether direct transfers meaningfully change the day-to-day financial calculus for people who would otherwise emigrate. That is an answerable, fundable question on its own, not a leap straight to a $7 trillion global commitment.
This kind of coordination is not hypothetical. Developed countries have already committed, through the UN’s climate finance process, to mobilise $100 billion a year for developing countries; at COP29 in November 2024, these states agreed a new goal of at least $300 billion a year by 2035, inside a wider $1.3 trillion ambition. Developing countries have rightly called that too small and too slow, and the same criticism would apply to any first GUBI pledge. But the machinery for getting dozens of governments to commit significant recurring funds to a shared global target already exists and already operates well; GUBI needs a bigger number on a tighter timeline not an invention from scratch.
The arithmetic has been done. The sourcing is public, and the moral imperative to reduce extreme poverty is clear on its own. The case is only strengthened by two further upsides that are plausible but not guaranteed: a reasonable assessment that investment in those highly vulnerable regions that people are leaving eases migration pressure over time, and the faith in a system that could offer some protection if AI-driven job losses prove as disruptive as the IMF fears. Neither of those needs to land for the core argument for GUBI to hold. What’s missing is a venue: a coalition of willing donor and recipient governments prepared to commission a binding feasibility study at a forum like the UN General Assembly, the UN Development Programme or the G20, rather than another round of pledges. That is a small, concrete step, and it’s the one still missing.
If you have influence, here’s an agenda:
- Inside government: push for a costed GUBI feasibility study on the agenda at the next UN General Assembly or G20 summit, not another round of pledges.
- Inside a multilateral institution: ask why the World Bank or IMF, which already hold most of this data, have not formally costed a proposal like this one.
- Inside philanthropy or research: fund independent replication of this model. The sourcing is public, so the biggest gap left is scrutiny, not secrecy.
- As a voter or a reader: stop letting “GUBI is just a thought experiment” go unchallenged. It is costed, and it deserves a real test. Say so.
Don Clancy is a data professional with a passion for social justice for all. He is a Technical Analysis and AI Automation Lead at the advertising agency VML South Africa and is based in Johannesburg.